Understanding the ETH/BTC Trading Pair: Insights and Predictions


As cryptocurrency continues to weave itself into the fabric of daily finance, understanding the nuances of trading pairs like ETH/BTC becomes increasingly crucial. This pair, a comparative value indicator between Ethereum (ETH) and Bitcoin (BTC), serves as a barometer for the broader altcoin market. In this blog post, we'll explore the significance of the ETH/BTC trading pair, its relation to the altcoin market, and share insights gleaned from a recent technical chart analysis.
What is ETH/BTC?
Simply put, the ETH/BTC pair indicates how much Bitcoin is needed to purchase one Ethereum. It's a direct financial translation of Ethereum's worth in terms of the original cryptocurrency, Bitcoin. If the pair trades at 0.07, for example, it would require 0.07 BTC to buy one ETH.
A Window into Altcoins
Ethereum is the de facto leader of the altcoin pack, making the ETH/BTC pair a critical signal of market sentiment. A strong performance of Ethereum against Bitcoin typically suggests a bullish outlook on altcoins. Investors interpret Ethereum’s rise as a sign of a healthy risk appetite, often translating into increased liquidity and interest in the altcoin market.
Technical Analysis and Prediction

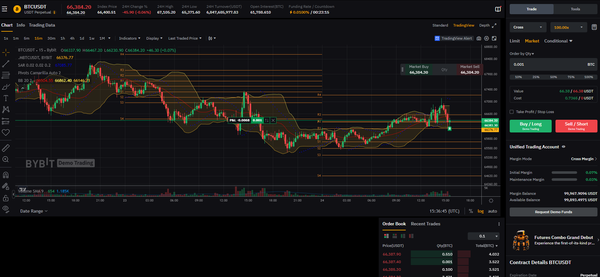
A recent chart from TradingView provides us with an analytical snapshot of the ETH/BTC pair's performance. Using various indicators such as Bollinger Bands, MACD, RSI, and volume, we can extract valuable insights:
Trend Indication
The chart reveals a series of dotted arrows, highlighting a recent bullish uptrend in the ETH/BTC pair. This suggests increased confidence from traders and might predict a continuation of this trend in the near term.
Volatility and Volume
Bollinger Bands show that the price of ETH in BTC is hovering near the lower band, hinting that ETH could be considered undervalued and may soon revert to the mean. The trading volume remains consistent, backing up the potential for sustained price movement.
Momentum Observations
The MACD indicator points to a bullish convergence, where the MACD line crosses above the signal line. Simultaneously, the RSI stays neutral, suggesting there’s room for upward movement before reaching overbought conditions.
Support and Resistance
Current trading seems to be sandwiched between well-defined support (S) and resistance (R) levels. The price's interaction with these levels will likely dictate short-term market movements.
A Cautious Outlook
Incorporating all these elements, we could cautiously predict that ETH/BTC may see a continuation of its current uptrend, potentially testing higher resistance levels if the bullish indicators hold true. However, market conditions are notoriously fickle, and reliance on technical analysis alone is not sufficient for making investment decisions.
A Grain of Salt
Predictions in the crypto world are often met with a mixture of skepticism and optimism. While technical analysis can offer educated guesses based on historical data, the unpredictable nature of cryptocurrencies requires investors to remain vigilant. It's vital to balance these technical insights with fundamental analysis and up-to-date market news.
In conclusion, while the ETH/BTC trading pair offers exciting insights into the crypto market dynamics, it also reflects the intricate dance between risk and reward. As always, any investment decision should be made with a full understanding of the market conditions, personal investment goals, and risk tolerance.
Disclaimer: This blog post is for educational purposes only and is not financial advice. The cryptocurrency market is highly volatile, and past performance is not indicative of future results. Always conduct your own research and consult with a financial advisor before making investment decisions.