Bollinger Bands in Action: A Practical Look at Market Volatility


When it comes to trading, one of the most insightful tools a trader can utilize is the Bollinger Bands (BB). This indicator not only helps in understanding market volatility but also provides a visual representation of potential overbought or oversold conditions. Let’s take a closer look at a practical example using the BB on a BTC USDT Perpetual chart.

Real-World Application of Bollinger Bands
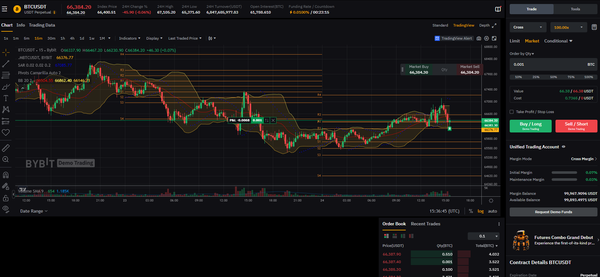
In the chart above, you can observe the Bitcoin market as analyzed through the lens of the Bollinger Bands. The middle line represents the 20-day simple moving average (SMA), offering a baseline for the market’s average performance over a given period.
Flanking this SMA are the upper and lower bands. The upper band sits two standard deviations above the SMA, and the lower band two standard deviations below it. These bands expand and contract based on the market's volatility, providing a dynamic view of market conditions.
Interpreting the Chart
- Periods of Expansion: Notice how the bands widen during periods of increased market volatility. This expansion suggests that traders should be prepared for potential price swings and increased trading opportunities.
- Periods of Contraction: Conversely, when the bands contract, it indicates a period of decreased volatility. Such 'squeezes' may precede significant price movements, alerting traders to be on high alert for a potential breakout.
- Overbought/Oversold Signals: As the price touches or exceeds the upper band, it may signify that the asset is entering overbought territory, suggesting a possible pullback. On the flip side, when the price dips to or below the lower band, the market could be oversold, hinting at a potential price recovery.
- Trending Markets: In the provided chart, you can see a strong uptrend indicated by the price consistently hugging the upper band. This is a visual cue of the market's bullish sentiment during that period.
Conclusion
Incorporating the real-time BTC USDT chart, we've explored the Bollinger Bands and how they can be interpreted in live market conditions. By understanding the dynamic between the price and the bands, traders are better equipped to make informed decisions, whether they are gauging volatility, identifying potential trend reversals, or looking for signs of market stability.
The Bollinger Bands, with their visual simplicity and depth of information, are indeed a powerful tool in a trader's arsenal. As with any technical indicator, they yield the best results when used in conjunction with other analysis methods, allowing traders to navigate the complex waters of market trading with greater confidence.