Understanding Support and Resistance Through a Trading Chart - BOMEUSDT


Support and resistance levels are cornerstones of technical analysis in trading. These concepts help traders understand the battle between supply and demand, providing insights into potential price movements. Let’s explore these concepts using the BOMEUSDT trading chart, which represents the price action of what we can assume is a cryptocurrency pair over a 15-minute period.
Exploring Support and Resistance on the BOMEUSDT Chart
The BOMEUSDT chart is a perfect canvas to illustrate how traders identify and interpret support and resistance levels.
What Are Support and Resistance?
- Support is a price level where a downtrend can be expected to pause due to a concentration of demand. As the price of an asset approaches support, it is typically believed that demand will overcome supply and prevent the price from falling below this level.
- Resistance is the opposite of support, a price level where a trend can stall or reverse due to a concentration of selling interest. As the price of an asset approaches resistance, supply is expected to overcome demand and prevent the price from rising above this level.

Deciphering the Chart
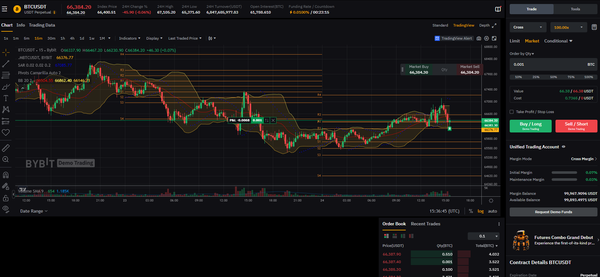
On this particular chart, support and resistance levels are clearly marked. The support levels are labeled as S1, S2, and so on, indicating where the price has previously encountered a floor. Resistance levels, marked as R1, R2, R3, and notably R5, signify where the price has found a ceiling.
- Support Levels: These can be spotted where the price has stopped falling and reversed to some extent, suggesting a buying interest that surpasses the selling pressure.
- Resistance Levels: When looking at R1 through R5, these are the points where upward price momentum has paused because sellers entered the market in greater numbers or buyers withdrew.
R5 as a Critical Resistance Level
In particular, R5 stands out as a higher resistance level. This indicates that it is a price point where in the past, sellers have significantly outnumbered buyers, halting upward price movement more decisively.
The Role of Bollinger Bands and Moving Averages
The chart features Bollinger Bands which highlight the volatility of the price. When the bands are distant from each other, it signals high volatility. The bands can also act as dynamic support and resistance; the lower band often acts as support, while the upper band can act as resistance.
The moving averages, depicted as smooth lines threading through the price bars, can offer additional insight. They often act as dynamic levels of support and resistance. If the price is above the moving averages, it might find support; if it's below, these lines can turn into resistance.
Volume and Price Action
Volume bars at the chart's bottom, displayed in red and green, represent the number of units traded. An increase in volume at a support or resistance level may affirm its strength.
The candlestick patterns on the chart represent price action and can further point out support and resistance. The chart's marked highs and lows serve as visual representations of these levels.
Wrapping It Up
The provided BOMEUSDT chart exemplifies the intricate nature of technical analysis, where support and resistance play pivotal roles. These levels guide traders on potential entry and exit points, helping in making strategic decisions regarding trades. It's important to note, however, that while support and resistance levels provide critical market insights, they are best used in conjunction with other indicators for a more rounded approach to market analysis.