Reflections on Tactical Trade Execution in LPTUSDT


I recently navigated through a series of trades that underscore the importance of data-driven decision-making. Here, I share a detailed review of my trade execution strategy, the rationale behind each decision, and how I integrated various data points and technical analysis tools to optimize my trades.

Entry Strategy: Timing the Market with Precision
My trading journey over the recent period was characterized by deliberate entry points. Leveraging the Bollinger Bands, I pinpointed moments when the price of LPTUSDT neared the lower band. This technical signal often indicates an oversold market condition, presenting a favorable buying opportunity.
I further reinforced these entry points by observing the trading volume. An uptick in volume concurrent with the price nearing the lower Bollinger Band served as a confirmation, increasing the probability of a successful trade by entering just before a potential price rebound.
Exit Strategy: Capitalizing on Peaks
Exiting at the right moment is as crucial as the entry. My exits were meticulously timed when the price hit or exceeded the upper Bollinger Band. Such scenarios typically suggest an overbought condition, foreshadowing a potential price correction or stabilization.
Additionally, I employed pivot point analysis, particularly watching the R4 level. This specific level is a trader’s cue, as breaching the R4 often indicates an exceptional bullish drive, but also serves as a harbinger for a possible pullback, making it an ideal moment for profit-taking.

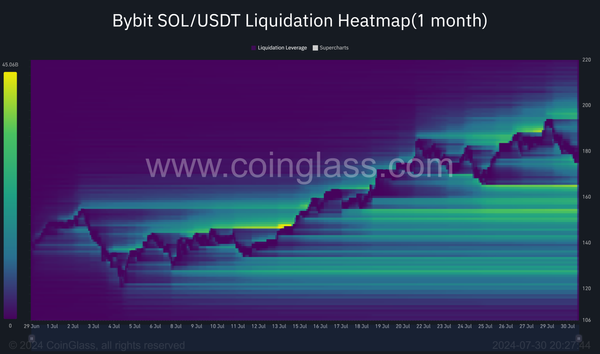
Leveraging Market Data: Liquidation Insights
One of the more nuanced aspects of my strategy was incorporating liquidation data. By analyzing liquidation maps, I could identify significant liquidation events, especially those involving high leverage positions. This information is invaluable as it can indicate a shift in market sentiment and momentum, leading to accelerated price movements in the direction opposite to the liquidated positions.
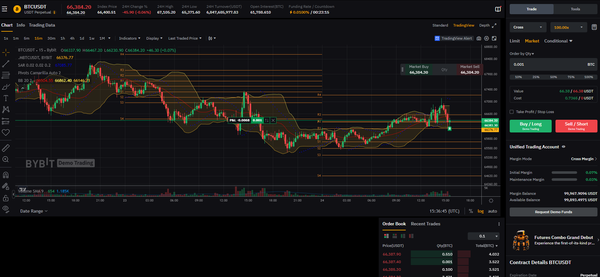
Technical Analysis: The Backbone of My Trades
The Moving Average Convergence Divergence (MACD) and the Parabolic Stop and Reverse (SAR) were central to my technical analysis. The MACD helped gauge the momentum, offering clues on whether the trend was gaining or losing strength. The SAR provided guidance on the trend direction, with the appearance of dots above the price action signaling a potential downtrend and thus, an opportunity to exit.
Adapting to Market Dynamics: A Continuous Process
Trading is never static, and adaptability is critical. I remain vigilant and ready to adjust my strategy based on real-time data. Monitoring the width of the Bollinger Bands and volume fluctuations will continue to be a part of my routine, serving as indicators of impending volatility.
Looking Ahead: Preparing for Future Market Conditions
The crypto market is volatile, and the LPTUSDT trading pair is no exception. As I look forward, my strategy will stay rooted in analyzing market leverage and liquidity, technical indicators, and global economic factors that could influence market conditions. The goal remains to maintain a disciplined approach to trading, balancing the potential for profit with prudent risk management.

Conclusion
The journey through the LPTUSDT trade has been a testament to the power of combining technical analysis with a keen understanding of market dynamics. My experiences remind me that information is king in the world of trading, and the ability to synthesize and act on that information swiftly separates successful trades from missed opportunities. As the market evolves, so will my strategies, always to capitalize on potential opportunities.