Mastering the Market: A Guide to Trading with RSI, Moving Averages, MACD, StochRSI, and Bollinger Bands

In the ever-evolving landscape of financial markets, leveraging technical indicators has become a widespread strategy among traders aiming to predict future market trends. Among the plethora of tools available, the Relative Strength Index (RSI), Moving Averages (MA), Moving Average Convergence Divergence (MACD), Stochastic RSI (StochRSI), and Bollinger Bands stand out for their effectiveness and reliability. This blog post delves into each of these indicators, offering insights into how they can be utilized to make informed trading decisions.
1. Relative Strength Index (RSI)
The RSI is a momentum oscillator that measures the speed and change of price movements on a scale of 0 to 100. Traditionally, the RSI is considered overbought when above 70 and oversold when below 30. Traders use these levels to predict potential reversals. For instance, an RSI reading above 70 suggests that a security is overbought and might reverse, while a reading below 30 indicates an oversold condition, potentially leading to a price increase.
Trading Strategy:
- Buy Signal: When the RSI crosses above the 30 level, indicating a potential reversal from oversold conditions.
- Sell Signal: When the RSI crosses below the 70 level, suggesting a possible downturn from overbought conditions.
2. Moving Averages (MA)
Moving Averages smooth out price data to create a single flowing line, making it easier to identify the direction of the trend. The two most common types are the Simple Moving Average (SMA) and the Exponential Moving Average (EMA). The SMA provides equal weight to all prices in the period, while the EMA gives more weight to recent prices.
Trading Strategy:
- Trend Identification: A rising MA indicates an uptrend, while a falling MA suggests a downtrend.
- Crossovers: A buy signal is generated when a shorter-term MA crosses above a longer-term MA. Conversely, a sell signal occurs when a shorter-term MA crosses below a longer-term MA.
3. Moving Average Convergence Divergence (MACD)
The MACD is a trend-following momentum indicator that shows the relationship between two moving averages of a security’s price. It consists of the MACD line (difference between the 12-day EMA and the 26-day EMA), the signal line (9-day EMA of the MACD line), and the histogram (difference between the MACD line and the signal line).
Trading Strategy:
- Signal Line Crossover: A buy signal is indicated when the MACD line crosses above the signal line, while a sell signal is suggested when the MACD line crosses below the signal line.
- Zero Cross: Buy when the MACD line crosses above zero, and sell when it crosses below zero.
4. Stochastic RSI (StochRSI)
The StochRSI is an oscillator that measures the level of the RSI relative to its high-low range over a set period of time. It combines the features of the Stochastic Oscillator and the RSI, making it more sensitive and capable of generating more frequent signals.
Trading Strategy:
- Overbought/Oversold: Similar to the RSI, readings above 0.8 are considered overbought, while readings below 0.2 are considered oversold.
- Crossovers: A buy signal occurs when the StochRSI crosses above 0.2, indicating a move from oversold conditions. A sell signal is generated when the StochRSI crosses below 0.8, suggesting a move from overbought conditions.
5. Bollinger Bands
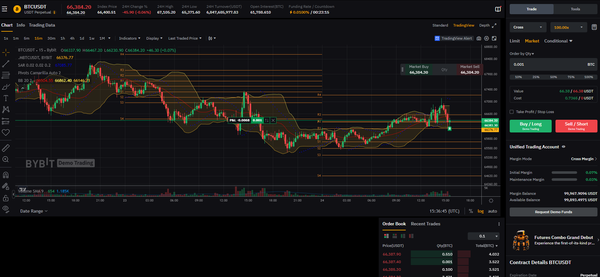
Bollinger Bands consist of a middle band being an N-period SMA, an upper band at K times an N-period standard deviation above the middle band, and a lower band at K times an N-period standard deviation below the middle band. These bands adjust themselves to market conditions by widening during periods of high volatility and contracting during less volatile periods.
Trading Strategy:
- Squeeze: A narrow band width indicates low volatility and is known as the Bollinger Band squeeze, often preceding a significant price movement.
- Band Breakouts: Price moving above the upper band may indicate an overbought condition, suggesting a sell signal, whereas a price below the lower band might indicate an oversold condition, presenting a buy signal.
Conclusion
While these indicators can provide valuable insights, it's crucial to remember that no indicator is foolproof. They should be used in conjunction with other analysis tools and within the context of a well-rounded trading strategy. Experiment with these indicators on a demo account to understand their nuances before applying them to live trades. Happy trading!


