Bitcoin Price Analysis: Navigating the $50,000 Barrier Amidst Selling Pressure and Economic Uncertainty


Introduction
Bitcoin (BTC) continues to exhibit significant volatility, facing both upward momentum and downward pressures. This comprehensive analysis dives into the recent technical charts, market news, and selling data to predict BTC’s short-term and medium-term movements, focusing on the critical $50,000 level.
Technical Chart Analysis
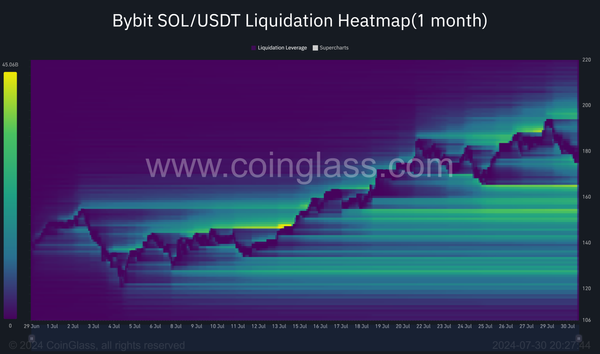
1. 24-Hour Liquidation Heatmap:
- Significant liquidation levels between $56,000 and $59,000 suggest this zone could act as strong support.
- Heavy liquidation levels between $59,000 and $60,000 indicate potential resistance.


2. Recent Liquidation Data:
- High liquidation levels around $57,702 to $58,685 suggest these levels will act as crucial resistance.
- Lower liquidation levels between $54,802 to $57,702 indicate a support zone, reinforcing the importance of these levels in the short-term trading strategy.
3. 1-Day (Daily) Chart:
- BTC is rebounding from a recent low near $53,000, indicating potential recovery.
- Key moving averages and pivot points suggest a possible upward movement toward $63,000 if the current momentum sustains.
- Volume analysis shows increased buying interest, supporting this upward trend.
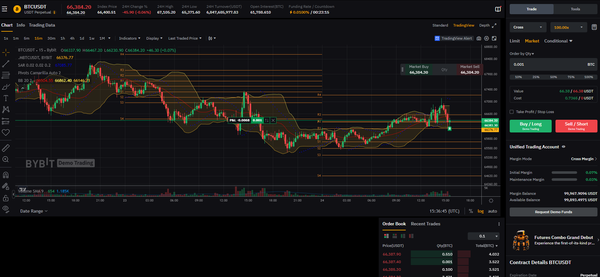
4. 4-Hour Chart:
- The price has broken through immediate resistance levels, indicating bullish momentum in the short term.
- Expansion of Bollinger Bands suggests increased volatility.
5. 1-Hour Chart:
- BTC has broken out from its recent downtrend and is currently around $57,857.
- Resistance at $58,239.2 and support at $57,227.1 are crucial short-term levels.
- Increased buying volume supports the potential continuation of the upward trend.
6. 15-Minute Chart:
- Higher highs and higher lows indicate an upward trend.
- Immediate resistance at $58,380.8 and support at $57,227.1.

7. Weekly Chart:
- The weekly chart shows BTC testing significant support levels around $57,940.58, with a key resistance level at $65,303.18.
- The price has recently faced downward pressure but remains above critical support.
Market News and Recent Selling Data
1. Selling Pressure and Resistance at $50,000:
- Recent market news indicates significant selling pressure as BTC approaches the $50,000 level. This selling pressure is attributed to profit-taking and large sell orders on major exchanges like Binance and Coinbase.
2. Fed Chief Powell's Comments:
- Fed Chief Jerome Powell recently stated that holding rates high for too long could jeopardize economic growth. This suggests a potential shift in monetary policy if economic indicators such as the CPI show continued weakness, which could influence BTC prices.
3. German Government BTC Sales:
- The German government is preparing for its next BTC selloff worth $276 million. This will likely add to the existing selling pressure on BTC prices. The continued offloading of BTC by the German government is significant for market dynamics.

4. Bitcoin Rebound and Choppiness:
- Analysts are noting the current choppiness in the market, with BTC showing a potential rebound toward $60,000 but likely facing persistent volatility. This choppiness is expected to continue as the market digests the ongoing sell-offs and macroeconomic factors, making it challenging for BTC to establish a stable upward trajectory in the near term.
5. Glassnode On-Chain Analysis:
- Glassnode reports that Bitcoin has experienced its deepest correction since late 2022, with over 2.8 million BTC held by short-term holders now underwater. Despite this, the losses remain relatively subdued compared to the market size. The report highlights the significant financial pressure on short-term holders but notes that long-term holders remain profitable, indicating a robust underlying market structure.
6. June CPI Inflation Report:
- The June CPI inflation report is a key economic indicator that will influence market sentiment. Higher-than-expected inflation figures could lead to discussions about potential rate hikes, which would impact both crypto and traditional financial markets. Conversely, lower inflation could provide relief to the market, supporting BTC prices.
Key Levels to Watch
- Support Levels: $57,227.1, $56,000, $53,000
- Resistance Levels: $58,239.2, $59,000, $60,000, $63,000
Updated Prediction with Emphasis on $50,000 Level and Recent Selling Data
Short-Term (Next few hours to a day):
- BTCUSDT is likely to test resistance around $58,239.2 and $59,000. Breaking through these levels could see a move towards the psychological barrier of $60,000.
- Immediate support levels to watch are $57,227.1 and $56,000. A break below these could lead to a retest of the $53,000 support zone.
Medium-Term (Next few days to a week):
- Sustaining current momentum could push BTC towards $63,000, as indicated by daily and 4-hour charts.
- Continued bullish momentum is necessary to break through significant resistance levels.
Critical Level - $53,000:
- The $53,000 level remains a crucial support. Any break below this could signal further downside potential, making it a key level to monitor.
Market Sentiment and Selling Pressure:
- The $50,000 level appears significant from a market sentiment perspective, driven by news of selling pressure and large sell orders.
- The German Government's recent selling activity could add downward pressure on BTC, making the $50,000 level an important psychological barrier.
Conclusion
Combining technical analysis, market news, and recent selling data, BTCUSDT shows potential for short-term bullish momentum with significant resistance around $58,239.2 and $59,000. The medium-term outlook remains cautiously optimistic if BTC can sustain momentum and break through critical resistance levels. The $53,000 level remains a crucial support to watch, as breaking below this could indicate further downside potential. Market sentiment and recent selling pressure highlight the importance of the $50,000 level, making it a key psychological barrier to monitor.